Custom Reports
Site Search > Analytics > Custom Reports
Analytics displays refresh every hour!
The Site Search analytics tables and graphs update once per hour.
A SearchStax Site Search solution’s Search App is a database that collects user search events from your search page. The Custom Reports (formerly “Power Search”) screen lets you filter this collection of keywords and content items. You can set up filters using the drop-down fields at the top of the screen. After selecting a time period, you can search for either Searches (keywords) or Items.
For Searches, we can filter for six search-related metrics. The form offers six inequality tests and a number input field.
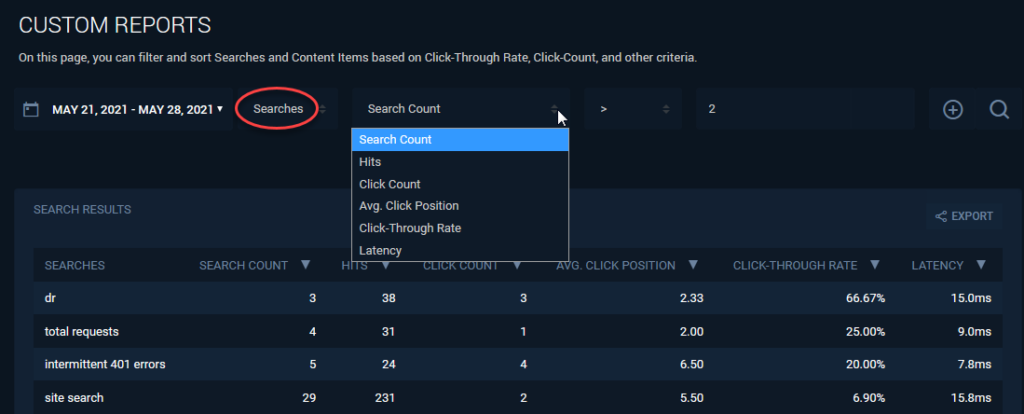
- Search Count: Number of searches in the selected time period that used this keyword.
- Hits: Number of items that match this search.
- Click Count: Number of click-through events resulting from these searches.
- Average Click Position: Average position of the result item that received a click-through event.
- Click-Through Rate: Percent of searches that received a click-through event.
- Latency: Average time to process a search.
For Items, we can filter for three metrics:
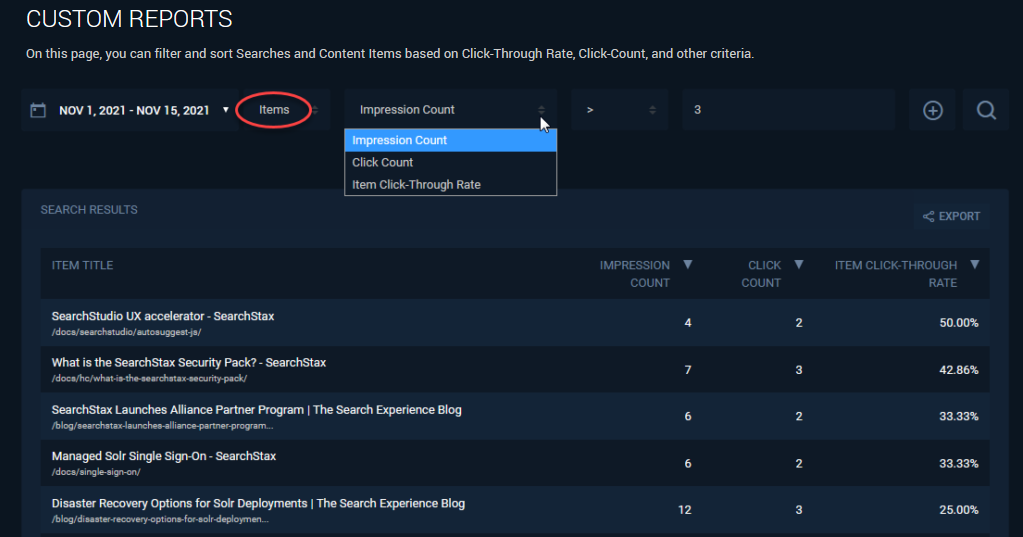
- Impression Count: Number of times this item was presented to users as a search result.
- Click Count: Number of times a user clicked on this item.
- Item Click-Through Rate: Percent of Impressions that received a click-through event.
At the far right of the line are two buttons: The (+) button lets us apply multiple filters simultaneously. The search button (magnifying glass) executes the current search.
A successful search produces a table of keywords or items. Note that you can sort the table by column, which opens up some powerful insights into the data. You can also Export the table as a .CSV file.
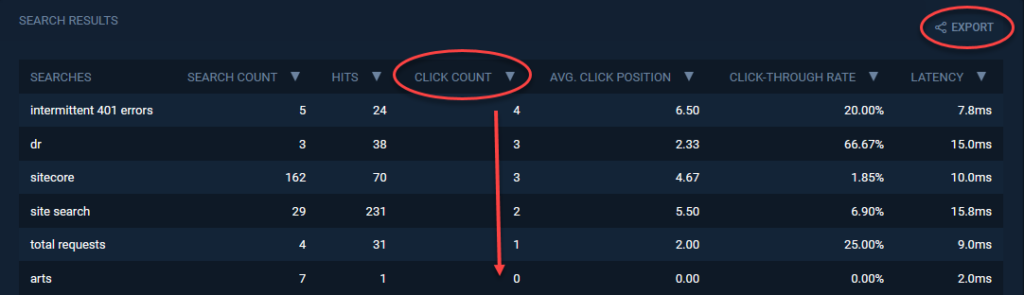
You can click through to a Search Details or Item Details screen as needed.
See our Analytics Glossary for a list of all SearchStax Site Search metrics.
Questions?
Do not hesitate to contact the SearchStax Support Desk.