Content Items
Site Search > Analytics > Content Items
Analytics displays refresh every hour!
The Site Search analytics tables and graphs update once per hour.
The SearchStax Site Search solution’s Content Items screen presents insights on the content that mattered most, least, and that did not interest the viewer. It shows lists of ranked result-items, and lets you click through to see the searches that led to each item.
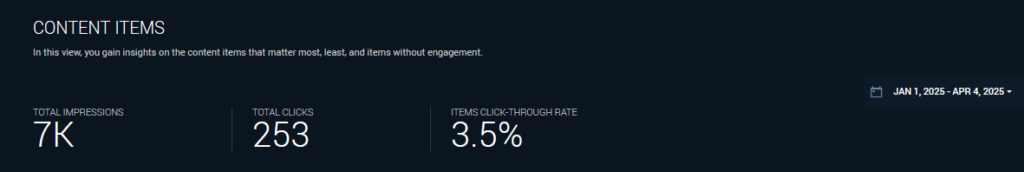
- Total Impressions: Number of result items displayed during the selected time interval.
- Total Clicks: Number of click-through events in the selected time interval.
- Items Click-Through Rate: Percentage of Total Impressions that received a click-through event.
The Most Clicked table shows the result items that were clicked the most.
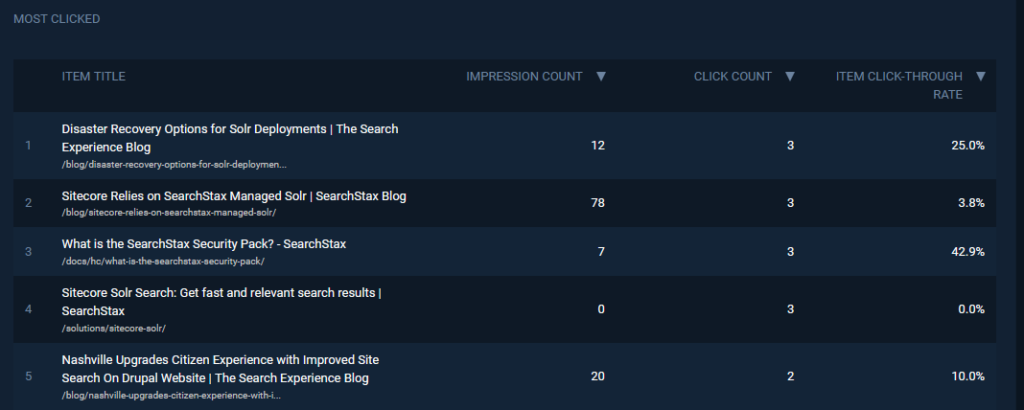
- Item Title: The title of a document that users clicked on during the selected time interval.
- Impression Count: The number of times that this item was presented to users in search results during the selected time interval.
- Click Count: Number of click-through events for this item in the selected time interval.
- Item Click-Through Rate: Percent of Impressions that were clicked on.
You can click on any item to see the Item Details view.
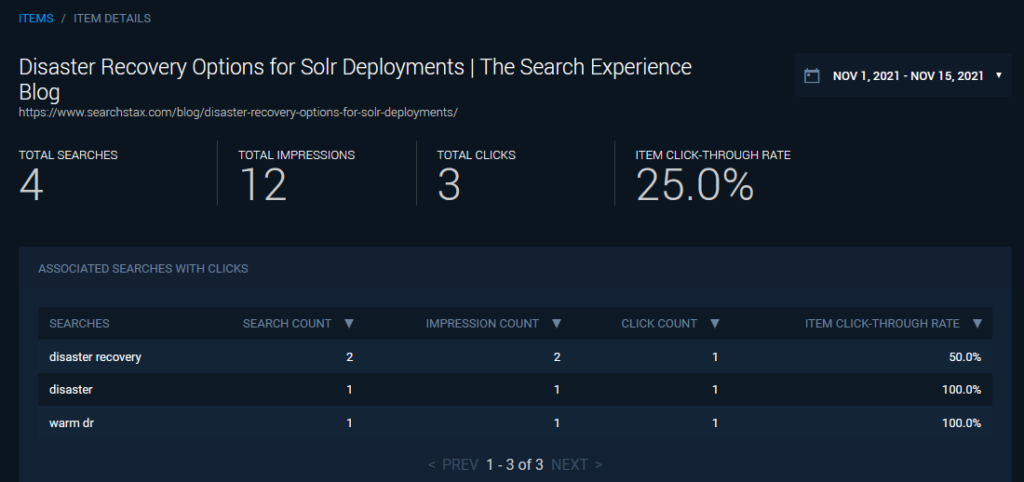
- Total Searches: Number of searches in this time period that matched this item.
- Total Impressions: Number of times the item was presented to users in the results list.
- Total Clicks: Number of click-through events on this item.
- Item Click-Through Rate: Percent of Impressions that received a click-through event.
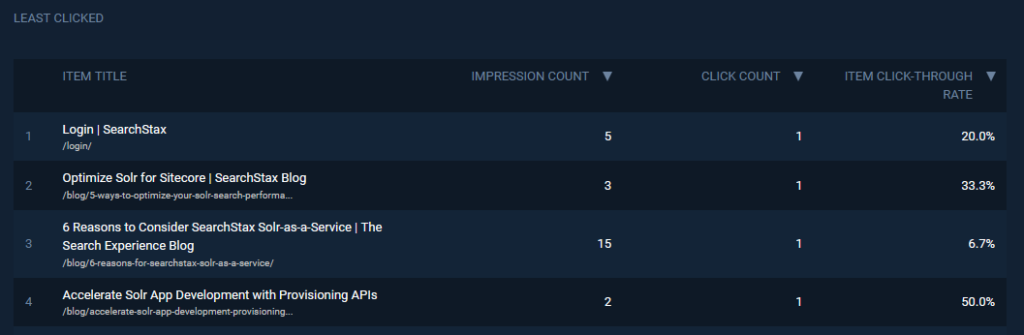
Use the “back” button to return to the Content Items screen. Scroll down to view the list of “Least Clicked,” meaning content items that had little or no engagement.
See our Analytics Glossary for a list of all SearchStax Site Search metrics.
Questions?
Do not hesitate to contact the SearchStax Support Desk.