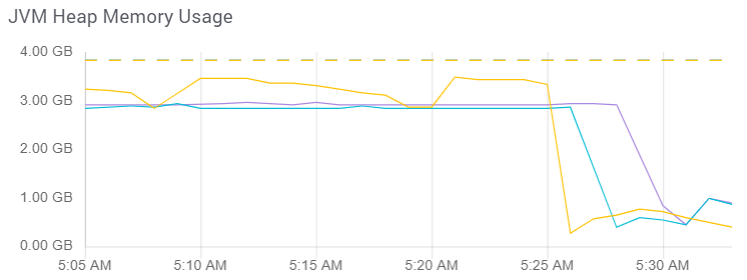
A JVM Heap Used alert is a Threshold Alert that notifies you by email when your SearchStax Managed Search service deployment has used more than some percentage of the available JVM memory for more than some number of minutes. This creates an Incident in the Managed Search Dashboard.
If the JVM level reaches 100%, Solr will stop, leaving behind an OOM-killer log file. Azure and GCP deployments will usually restart automatically. AWS deployments may need to be manually stopped and restarted.
Heavy Indexing Load
High JVM is often associated with a heavy episode of indexing, either in terms of the number of /update requests, number of documents per request, or the size of the documents.
Excessive commit requests can slow indexing down to the point the JVM fills up.
If the alerts are associated with indexing events, consider throttling back the flow of /update messages.

This situation can be relieved by performing a rolling restart (as shown above). Contact SearchStax Support if you need any help there.
Heavy Query Load
Queries that involve faceting, grouping, or sorting of results can fill up JVM. So can queries that involve deep pagination of results.
One common problem is queries that request too many results. Sitecore, for instance, asks for one million result items on every query as a default. Solr allocates memory for every item, needlessly filling up JVM.
Deployment Upgrade
Solr projects that constantly index new data will eventually outgrow their Managed Search deployments. Chronic JVM issues might mean that it is time to upgrade. Please open a ticket with SearchStax Support to evaluate this situation.
Questions?
Do not hesitate to contact the SearchStax Support Desk.

