SearchStax Site Search Dashboard
Site Search > Analytics > Dashboard
Analytics – Dashboard is the landing page for entering the SearchStax Site Search solution. It displays summary statistics for the selected Search App. To select an App, pull down the menu in the navigation bar on the left margin of the screen.
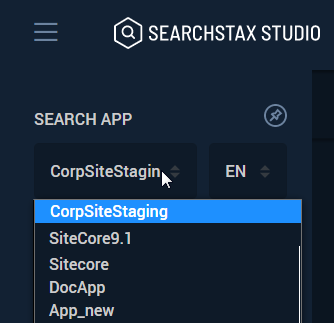
The summary statistics are relative to the date range. There are several predefined ranges plus a custom Date Range option.
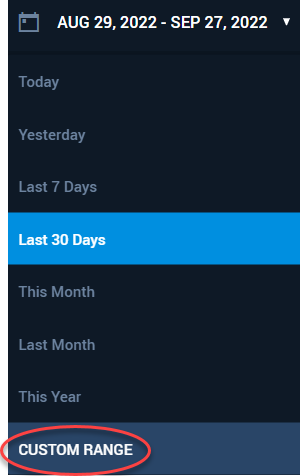
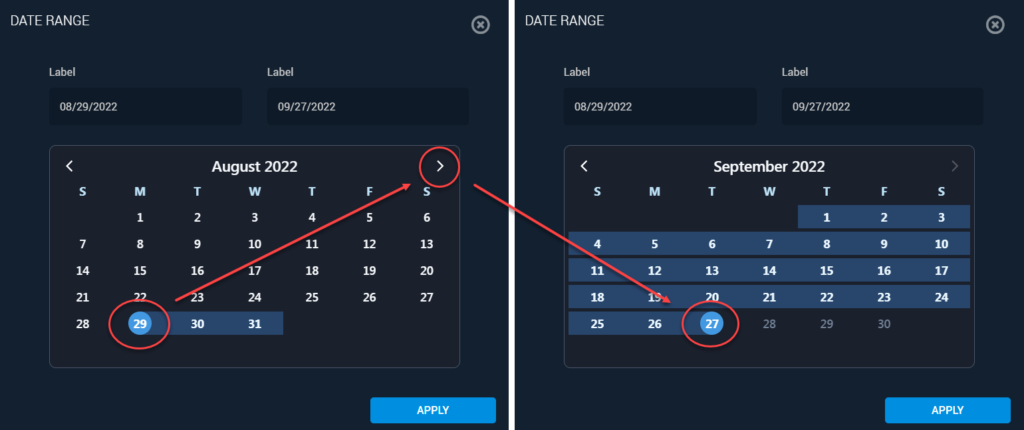
The Date Range presents a calendar display where you can select a starting date, navigate to another month if necessary, and select an ending date. Click Apply to refresh the Dashboard.
Note that the Search App retains user data for a limited time dependent on your Product Plan. In a live system, new analytics data is recorded in a constant stream. The new events usually appear on the Dashboard within an hour of posting, but there are situations where a 24-hour delay can occur.
During the last month, this selected App recorded over 579 searches, and 160 searches with click-through events. Roughly 27% of the searches ended with a clicked item.

Average search latency (time between request and response) was 8.5 ms, which was a 6% decrease from the previous month. Decreased latency is a good sign, so the percent increase figure is highlighted in green. (Bad news is red.)
Farther down on the same screen are graphs depicting various measures of search success.
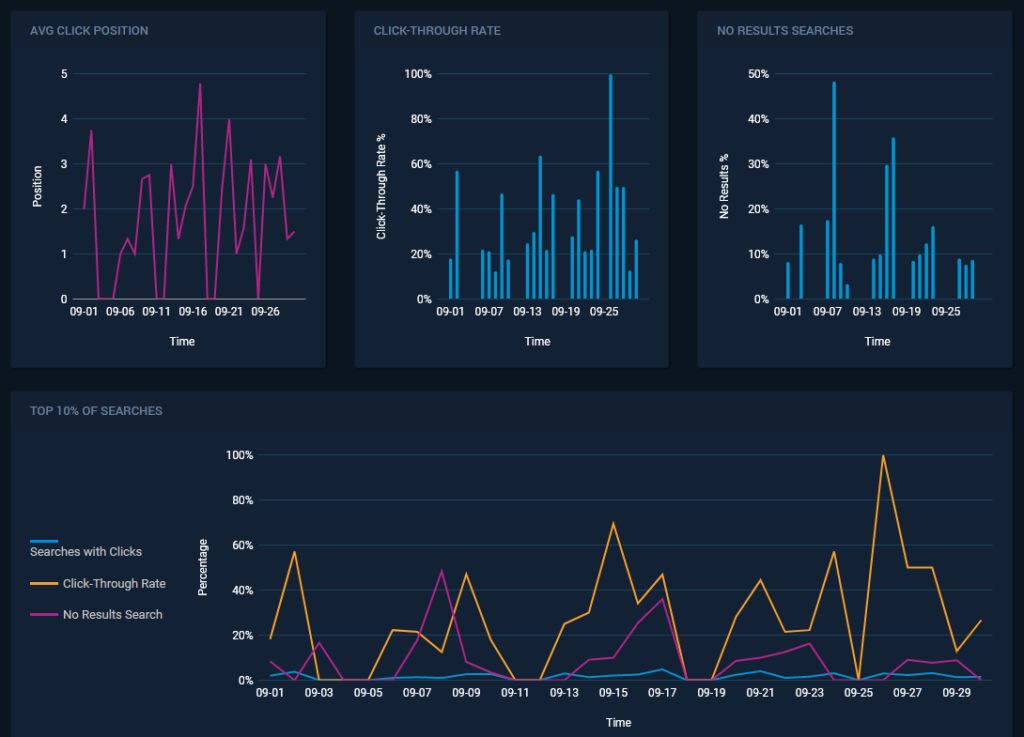
- Average Click Position: The average position of clicked items in the search results over a specific time interval (one month in the illustration). We would like to see this trending downward, meaning that the selected result was getting closer to the top of the list.
- Click-Through Rate: Click-through events divided by number of searches in a specific time interval, expressed as a percent. We would like to see this trending upward, meaning that users are finding more items of interest.
- No Results Searches: Percent of total searches that produced zero results over a specific time period. We would like to see this trend downward. Adjust suggestions, improve spelling correction, add synonyms, or create new content to improve.
At the bottom of the page is a graph depicting the activity around Related Searches.
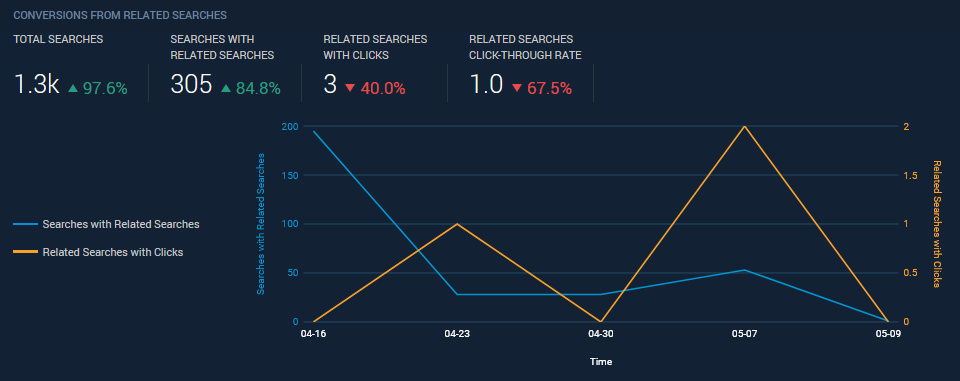
- Total Searches: All searches logged during the selected time interval.
- Searches with Related Searches: Number of total searches that offered at least one Related Search.
- Related Searches with Clicks: Number of Related Searches that were launched by the search user.
- Related Searches Click-Through Rate: “Related Searches with Clicks” divided by “Searches with Related Searches” x 100.
See our Analytics Glossary for a list of all SearchStax Site Search metrics.
Questions?
Do not hesitate to contact the SearchStax Support Desk.

